Note
Click here to download the full example code
Sixth Example: Encapsulating several blocks into a PipeGraph and reusing it
- A demonstration of several interesting features will be done in the following examples:
- How the user can choose to encapsulate several blocks into a PipeGraph and use it as a single unit in another PipeGraph
- How these components can be dynamically built on runtime depending on initialization parameters
- How these components can be dynamically built on runtime depending on input signal values during fit
- Using GridSearchCV to explore the best combination of hyperparameters
We consider Example number five in which we had the following steps:
- scaler: A
MinMaxScalerdata preprocessor - classifier: A
GaussianMixtureclassifier - demux in charge of splitting the input arrays accordingly to the selection input vector
- lm_0: A
LinearRegressionmodel - lm_1: A
LinearRegressionmodel - lm_2: A
LinearRegressionmodel - mux: A custom
Multiplexerclass in charge of combining different input arrays into a single one accordingly to the selection input vector
For instance, we can find interesting to encapsulate the Demultiplexer, the linear model collection, and the Multiplexer into a single unit: We prepare the data and build a PipeGraph with these steps alone:
import numpy as np
import pandas as pd
import matplotlib.pyplot as plt
from sklearn.preprocessing import MinMaxScaler
from sklearn.mixture import GaussianMixture
from sklearn.linear_model import LinearRegression
from pipegraph.base import PipeGraph, PipeGraph, Demultiplexer, Multiplexer
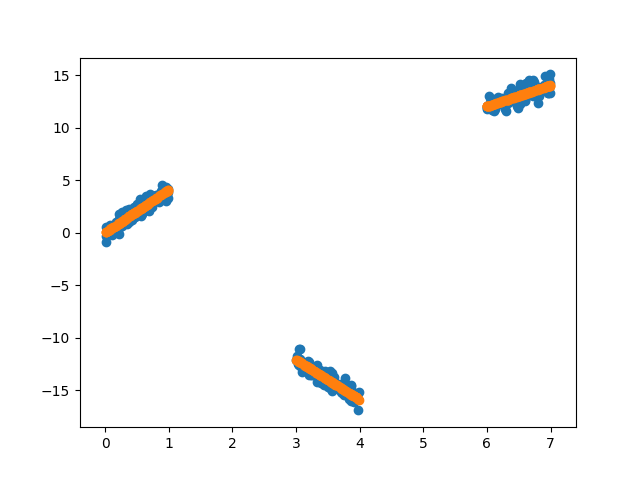
X_first = pd.Series(np.random.rand(100,))
y_first = pd.Series(4 * X_first + 0.5*np.random.randn(100,))
X_second = pd.Series(np.random.rand(100,) + 3)
y_second = pd.Series(-4 * X_second + 0.5*np.random.randn(100,))
X_third = pd.Series(np.random.rand(100,) + 6)
y_third = pd.Series(2 * X_third + 0.5*np.random.randn(100,))
X = pd.concat([X_first, X_second, X_third], axis=0).to_frame()
y = pd.concat([y_first, y_second, y_third], axis=0).to_frame()
demux = Demultiplexer()
lm_0 = LinearRegression()
lm_1 = LinearRegression()
lm_2 = LinearRegression()
mux = Multiplexer()
three_multiplexed_models_steps = [
('demux', demux),
('lm_0', lm_0),
('lm_1', lm_1),
('lm_2', lm_2),
('mux', mux), ]
three_multiplexed_models_connections = {
'demux': {'X': 'X',
'y': 'y',
'selection': 'selection'},
'lm_0': {'X': ('demux', 'X_0'),
'y': ('demux', 'y_0')},
'lm_1': {'X': ('demux', 'X_1'),
'y': ('demux', 'y_1')},
'lm_2': {'X': ('demux', 'X_2'),
'y': ('demux', 'y_2')},
'mux': {'0': 'lm_0',
'1': 'lm_1',
'2': 'lm_2',
'selection': 'selection'}}
three_multiplexed_models = PipeGraph(steps=three_multiplexed_models_steps,
fit_connections=three_multiplexed_models_connections )
Now we can treat this PipeGraph as a reusable component and use it as a unitary step in another PipeGraph:
scaler = MinMaxScaler()
gaussian_mixture = GaussianMixture(n_components=3)
models = three_multiplexed_models

steps = [('scaler', scaler),
         ('classifier', gaussian_mixture),
         ('models', three_multiplexed_models), ]

connections = {'scaler': {'X': 'X'},
               'classifier': {'X': 'scaler'},
               'models': {'X': 'scaler',
                          'y': 'y',
                          'selection': 'classifier'},
               }

pgraph = PipeGraph(steps=steps, fit_connections=connections)
pgraph.fit(X, y)
y_pred = pgraph.predict(X)
plt.scatter(X, y)
plt.scatter(X, y_pred)
Total running time of the script: ( 0 minutes 0.037 seconds)