Note
Click here to download the full example code
Fifth Example: Demultiplexor - multiplexor
An imaginative layout using a classifier to predict the cluster labels and fitting a separate model for each cluster.
Steps of the PipeGraph:
- scaler: A
MinMaxScalerdata preprocessor - classifier: A
GaussianMixtureclassifier - demux: A custom
Demultiplexerclass in charge of splitting the input arrays accordingly to the selection input vector - lm_0: A
LinearRegressionmodel - lm_1: A
LinearRegressionmodel - lm_2: A
LinearRegressionmodel - mux: A custom
Multiplexerclass in charge of combining different input arrays into a single one accordingly to the selection input vector
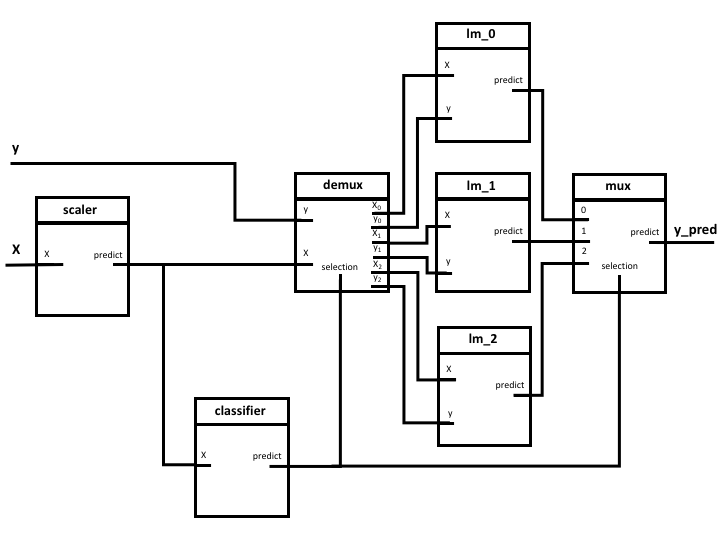
Figure 1. PipeGraph diagram showing the steps and their connections
import numpy as np
import pandas as pd
from sklearn.preprocessing import MinMaxScaler
from sklearn.linear_model import LinearRegression
from sklearn.model_selection import GridSearchCV
from pipegraph.base import PipeGraph, Demultiplexer, Multiplexer
import matplotlib.pyplot as plt
from sklearn.mixture import GaussianMixture

X_first = pd.Series(np.random.rand(100,))
y_first = pd.Series(4 * X_first + 0.5*np.random.randn(100,))
X_second = pd.Series(np.random.rand(100,) + 3)
y_second = pd.Series(-4 * X_second + 0.5*np.random.randn(100,))
X_third = pd.Series(np.random.rand(100,) + 6)
y_third = pd.Series(2 * X_third + 0.5*np.random.randn(100,))

X = pd.concat([X_first, X_second, X_third], axis=0).to_frame()
y = pd.concat([y_first, y_second, y_third], axis=0).to_frame()

scaler = MinMaxScaler()
gaussian_mixture = GaussianMixture(n_components=3)
demux = Demultiplexer()
lm_0 = LinearRegression()
lm_1 = LinearRegression()
lm_2 = LinearRegression()
mux = Multiplexer()


steps = [('scaler', scaler),
         ('classifier', gaussian_mixture),
         ('demux', demux),
         ('lm_0', lm_0),
         ('lm_1', lm_1),
         ('lm_2', lm_2),
         ('mux', mux), ]
Instead of using inject as in previous example, in this one we are going to pass a dictionary
describing the connections to PipeGraph constructor
connections = { 'scaler': {'X': 'X'},
'classifier': {'X': 'scaler'},
'demux': {'X': 'scaler',
'y': 'y',
'selection': 'classifier'},
'lm_0': {'X': ('demux', 'X_0'),
'y': ('demux', 'y_0')},
'lm_1': {'X': ('demux', 'X_1'),
'y': ('demux', 'y_1')},
'lm_2': {'X': ('demux', 'X_2'),
'y': ('demux', 'y_2')},
'mux': {'0': 'lm_0',
'1': 'lm_1',
'2': 'lm_2',
'selection': 'classifier'}}
pgraph = PipeGraph(steps=steps, fit_connections=connections)
pgraph.fit(X, y)
#%%
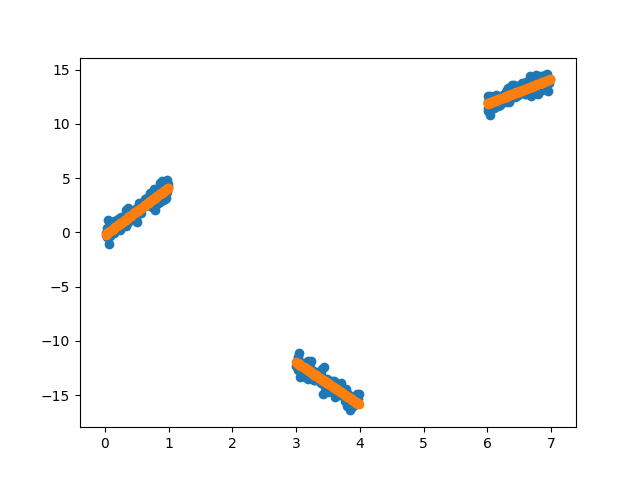
y_pred = pgraph.predict(X)
plt.scatter(X, y)
plt.scatter(X, y_pred)
Total running time of the script: ( 0 minutes 0.031 seconds)