Note
Click here to download the full example code
First example: A simple linear workflow
Let’s start with a simple example that could be perfectly expressed using a Pipeline. The data is transformed using a MinMaxScaler step and the preprocessed data is fed to a linear model.
Steps of the PipeGraph:
- scaler: preprocesses the data using a
MinMaxScalerobject - linear_model: fits and predicts a
LinearRegressionmodel
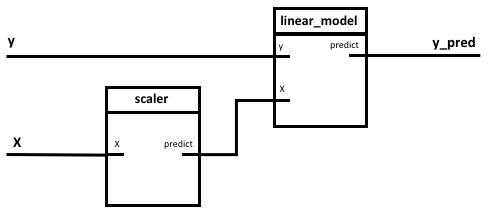
Figure 1. PipeGraph diagram showing the steps and their connections
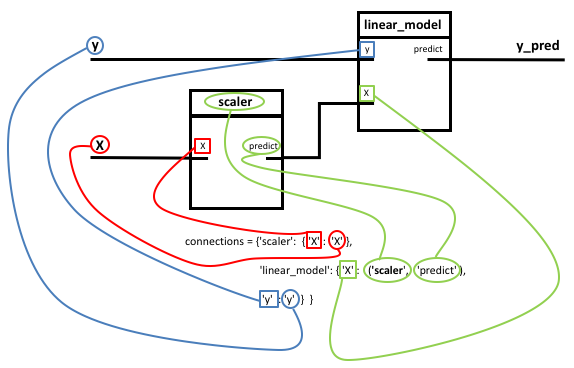
Figure 2. Illustration of the connections of the PipeGraph
Firstly, we import the necessary libraries and create some artificial data
import numpy as np
import matplotlib.pyplot as plt
from sklearn.preprocessing import MinMaxScaler
from sklearn.linear_model import LinearRegression
from sklearn.pipeline import Pipeline
from pipegraph import PipeGraph

X = np.random.rand(100, 1)
y = 4 * X + 0.5*np.random.randn(100, 1)
Secondly, we define the steps of the PipeGraph as a list of tuples (label, sklearn object) as if we were defining a standard Pipeline.
scaler = MinMaxScaler()
linear_model = LinearRegression()
steps = [('scaler', scaler),
        ('linear_model', linear_model)]
- As the last step is a regressor, a
PipeGraphRegressoris instantiated. - The results from applying
fitandpredictand predict data are shown.
pgraph = PipeGraph(steps=steps)
pgraph.fit(X, y)
y_pred = pgraph.predict(X)
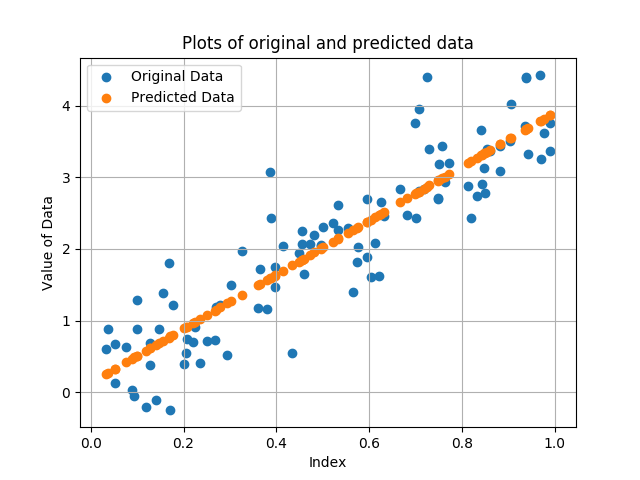
plt.scatter(X, y, label='Original Data')
plt.scatter(X, y_pred, label='Predicted Data')
plt.title('Plots of original and predicted data')
plt.legend(loc='best')
plt.grid(True)
plt.xlabel('Index')
plt.ylabel('Value of Data')
plt.show()
This example described the basic configuration of a PipeGraphRegressor. The following examples show more elaborated cases in order of increasing complexity.
Total running time of the script: ( 0 minutes 0.787 seconds)